Non-covalent interactions
Purpose
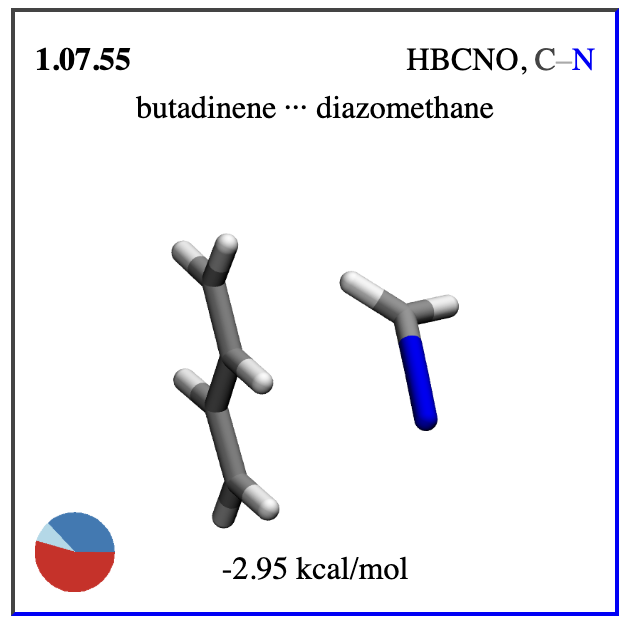
This benchmark tests if the MLIP can reproduce interaction energies of molecular complexes driven by non-covalent interactions. Non-covalent interactions are of highest importance for the structure and function of every biological molecule. This benchmark assesses a broad range of interaction types: London dispersion, hydrogen bonds, ionic hydrogen bonds, repulsive contacts and sigma hole interactions.
Description
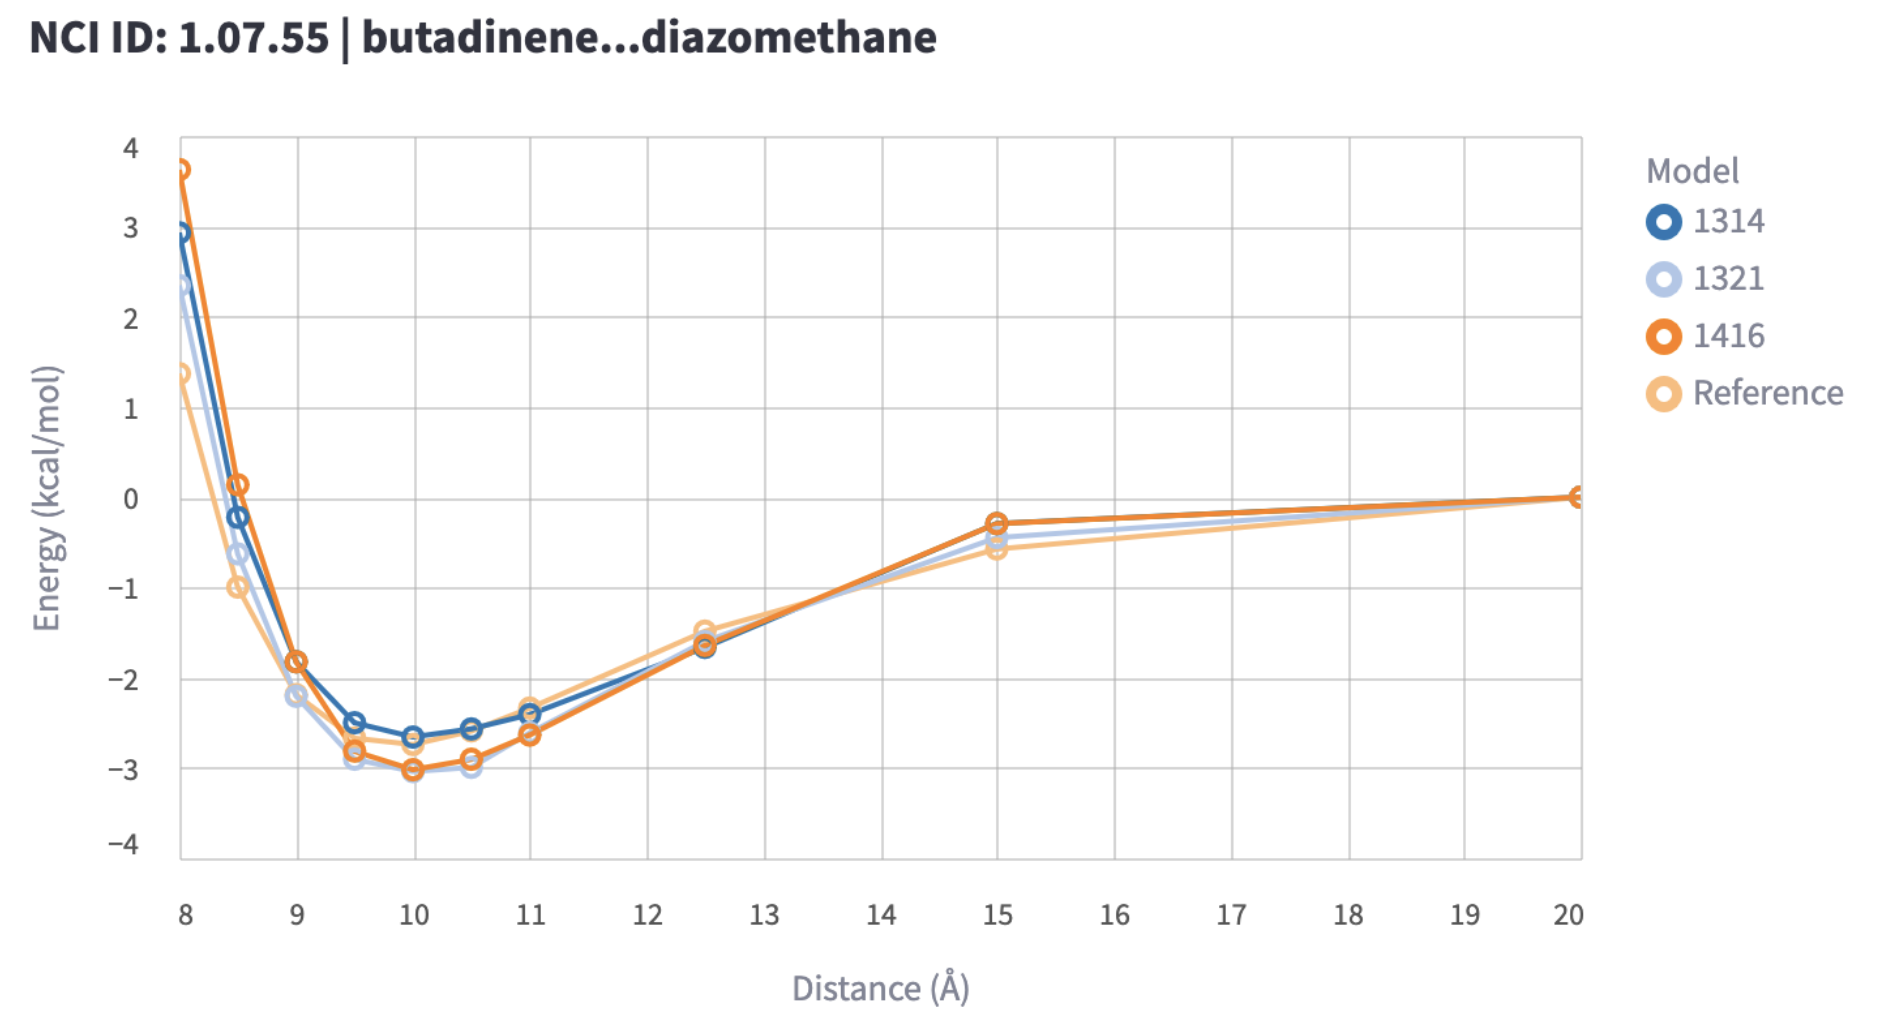
The benchmark leverages the mlip library for model energy inference on all structures corresponding to the distance scans of bi-molecular complexes in the dataset. The key metric is the RMSE of the interaction energy, which is the minimum of the energy well in the distance scan, relative to the energy of the dissociated complex, compared to the QM reference data. For repulsive contacts, the maximum of the energy profile is used instead.
Note that some of the molecular complexes in the benchmark dataset contain exotic elements (see dataset section). If the benchmarked MLIP cannot run an element of a molecular complex, the complex will simply be skipped.
|
|
Dataset
This benchmark uses the datasets from the NCI Atlas, with dissociation energy profiles. These datasets contain QM optimized geometries, along with CCSD(T)/CBS level interaction energies. The molecular complexes of these datasets contain typical organic small molecules, but also more exotic species and elements. Here is a summary of the datasets used in this benchmark:
Dataset Name |
Type of interaction |
Subsets |
|---|---|---|
D442x10 |
London dispersion |
Noble Gases, Boron, HCNO, Halogens |
HB375x10 |
Hydrogen bonds |
OH-N, OH-O, OH-C, NH-N, NH-O, … |
HB300SPXx10 |
Hydrogen bonds extended to S, P and halogens |
XH-S, XH-P, XH-Cl, XH-Br |
IHB100x10 |
Ionic hydrogen bonds |
O, N, C with cationic donors and anionic acceptors |
R739x5 |
Repulsive contacts |
HCNO, halogens, PS |
SH250x10 |
Sigma hole interactions |
P, S, Br, Cl, I |
Interpretation
The RMSE of the interaction energies should be as low as possible. This metric is likely to be very different for the different interaction types and data subsets. The RMSE in interaction error should be compared per interaction type and then in a more fine-grained visualization for the data subsets to identify areas of weakness for the MLIP. Within these areas of weakness, individual dissociation energy profiles can be visually inspected to see how they compare to the reference.